You can download an Excel or CSV file to view how many tokens users on your team used, which products they accessed, and on which days directly from the Token usage reporting pages.
- Sign into your Autodesk account.
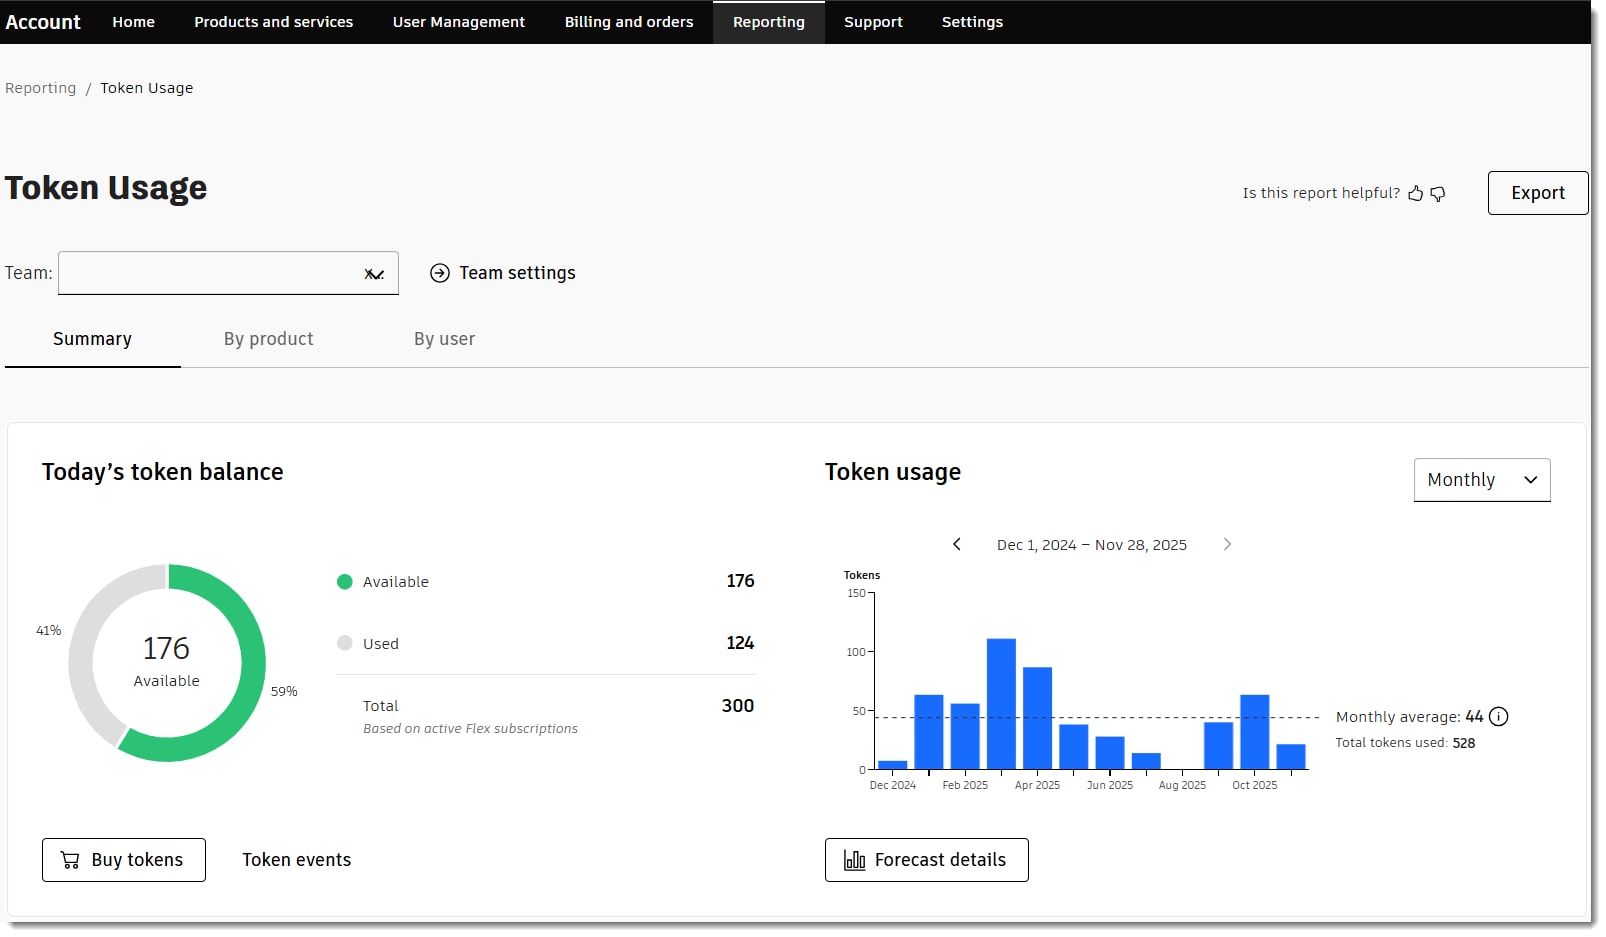
- Select Reporting > Token usage.
- Select your team and the date range for the export.
- Choose Export.
- In the side panel, choose whether you want to download the report as an Excel or a CSV file.
- The export begins, and the system automatically downloads your files when they are ready. You can close the information pop-up, and the report export will continue.
- You can access all your exports in your Autodesk account under Reporting > Export or in your browser's default download folder.
- Export history in account shows your recent exports. You can download a report or delete it from this page. You can view a report on this page if you initiated the export.
Note: We automatically delete past exports after 14 days to maintain security and manage storage.
Schedule token usage report
You can schedule the token usage report to automatically send you an email when your report is ready to download. The process works the same way for usage, seat, and token reports.
Change Notification: We plan to retire the combined Seat and Token Usage export file under Reporting > Export > Usage (with date range) in 2026. You will be able to use two separate export files for Seat Usage and Token Usage, like the Token Usage export described above. If you haven’t used the Seat usage and Token usage pages for your exports, we encourage you to get familiar with them and transition to the separate files as soon as feasible for your organization.
To learn more about exported data, see export data fields.